


Sustainability
- HOME>
- Sustainability>
- E:Environment>
- Disclosures based on TCFD recommendations
Disclosures based on TCFD recommendations
Recognizing protection of the global environment as an important topic for all humanity, Kamigumi strives to minimize its environmental impact through business activities that account for the environment. Kamigumi seeks to achieve harmony between its business activities and environmental conservation.
We support the recommendations of the Task Force on Climate-related Financial Disclosures (TCFD), a task force established in 2015 by the Financial Stability Board (FSB). Since FY2022, we have been analyzing and assessing the risks presented by climate change to financial markets and disclose information in accordance with TCFD recommendations on governance, risk management, strategy, and indicators and targets. In FY2024, we made revisions with the help of external experts.

Governance
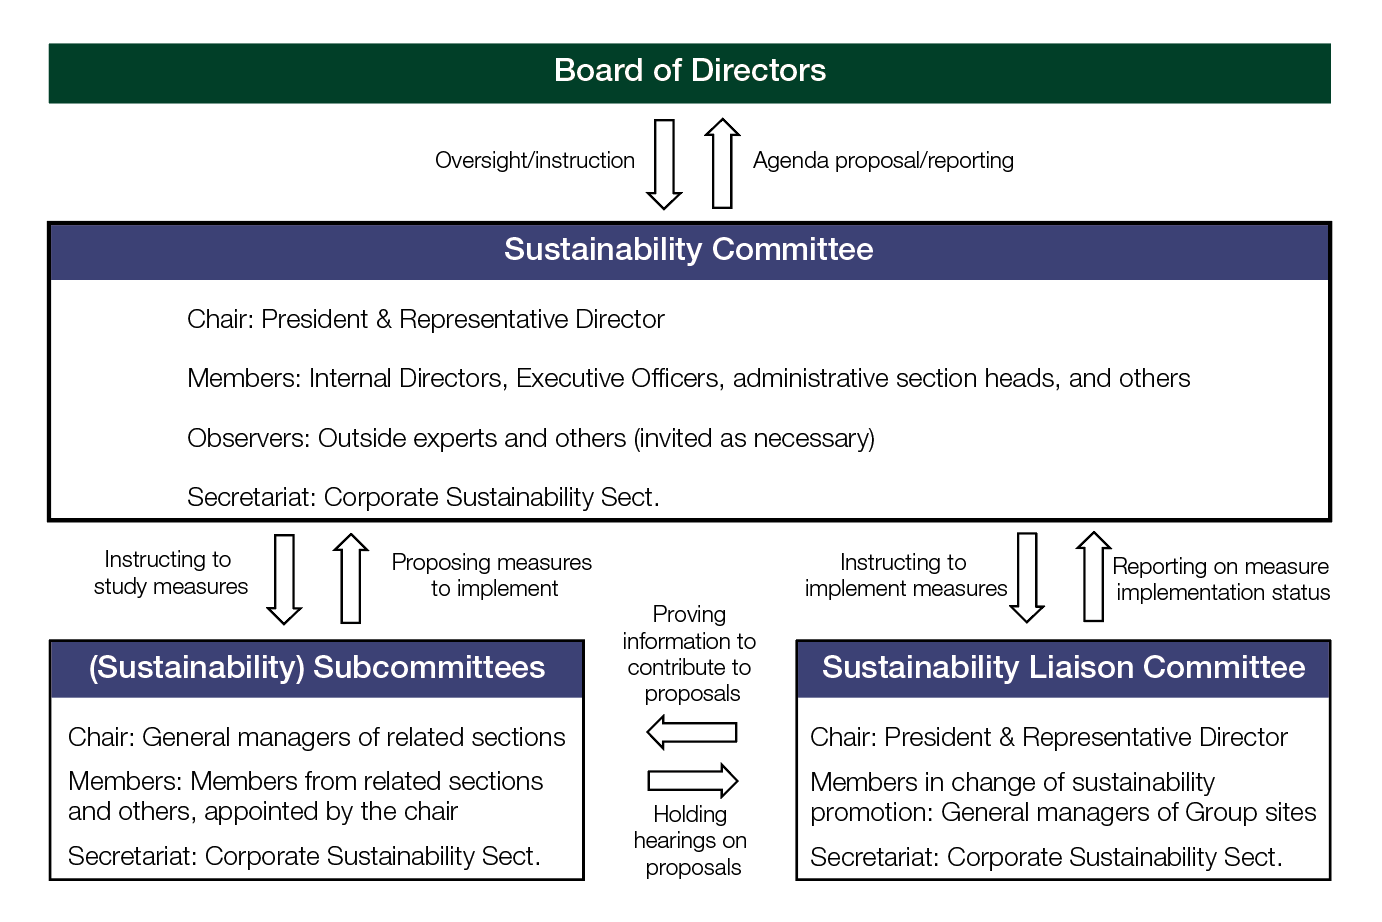
Kamigumi has established a Sustainability Committee, for which the President & Representative Director serves as chair, to consider and make decisions on matters related to climate change. The Sustainability Committee considers and makes decisions on related policies and measures, and reports or refers them as necessary to the Board of Directors for consideration.
This Committee also monitors progress and results related to the Company’s materiality items, including decarbonization targets, reports to the Board of Directors at least twice a year on the need for improvements and related issues, and drafts necessary measures.
The Board of Directors oversees climate change initiatives based on submissions and reports from this Committee and provides instruction as necessary.
The Sustainability Committee consists of internal directors, executive officers, administrative section heads, and others. The Corporate Sustainability Sect. serves as its secretariat, and the committee solicits advice from outside experts as necessary. Operationally, Sustainability Subcommittees and the Sustainability Liaison Committee have been established underneath, with all bodies working in coordination.
Risk management
In addition to various risks such as disaster risk, information risk, employment and personnel risk, the Group has also established Risk Management Rules for environmental risks, and regularly holds the Compliance and Risk Management Committee (hereinafter referred to as Committee) to manage, improve and strengthen risks. This committee is chaired by the President, and consists of the head office managers as members.
In addition, we have set up a Risk Management Department as a permanent department, and there are ten people who specialize in safety, customs clearance, and quality, three of whom are in the operation secretariat of the Committee.
The Sustainability Committee is in charge of risk management for sustainability, including climate change. As part of this effort, the Committee monitors climate change progress and regulatory trends while identifying risks and opportunities related to climate change under 1.5℃ and 4℃ scenarios over a medium- to long-term timeframe and assessing potential financial impact. The Committee periodically reassesses risks and opportunities thus identified and reports on, or submits, them for consideration to the Board of Directors at least once a year. After prioritizing the risks, decisions are made on how to manage them (mitigate, transfer, accept, or control). By conducting this scenario analysis annually, we regularly review climate change-related risks.
In addition, climate-related risks reported to, or submitted, for consideration by the Board of Directors are reported to the Compliance and Risk Management Committee, and preparations are underway to treat these as company-wide risks.
Scenario analysis
■ Baselines for scenario analysis
We conduct scenario analysis to assess the medium- to long-term risks and opportunities related to climate change for our business and consider countermeasures. In this fiscal year’s analysis, which focused on our domestic non-consolidated operations, we identified risks and opportunities assumed to impact us by FY2030 and FY2050, and examined their potential financial impacts and countermeasures. As baseline scenarios, we assumed a 4℃ scenario where existing policies remain unchanged, and a 1.5℃ scenario where decarbonization policies are aggressively implemented to limit the global average temperature rise to 1.5℃ above pre-industrial levels at the end of the 21st century.
| 1.5℃ Scenario | 4℃ Scenario | |
|---|---|---|
|
Assumed outcomes |
A scenario where decarbonization policies and regulations are assumed to be implemented and technological development advances to limit the global average temperature rise to 1.5℃ above pre-industrial levels at the end of the 21st century. | A scenario where the global average temperature rises 4℃ above pre-industrial levels at the end of the 21st century, increasing physical damage from typhoons and other phenomena. Policy and regulation, as well as technological development, are assumed to remain unchanged. |
|
Scenarios referenced* |
|
|
- * Overview of the scenarios referenced:
IEA NZE: The 1.5℃ equivalent scenario published by the International Energy Agency (IEA). A scenario that achieves net zero by 2050.
IEA STEPS: The 4℃ equivalent scenario published by the International Energy Agency (IEA). A scenario where existing policies remain unchanged without additional measures.
IPCC: Abbreviation for the Intergovernmental Panel on Climate Change.
IPCC SSP 1-1.9: IPCC’s 1.5℃ equivalent scenario. CO2 emissions reach net zero around 2050, limiting temperature rise to 1.5℃ at the end of the 21st century.
IPCC SSP 5-8.5: IPCC’s 4℃ equivalent scenario. Both CO2 emissions and average temperatures continue to rise, with temperatures projected to increase by more than 4℃ at the end of the 21st century.
■ Process for conducting scenario analysis
As part of our scenario analysis, we first listed all potential climate-related transition risks, physical risks, and opportunities across our entire value chain. From this list, we extracted items deemed to have a particularly significant impact on our company. Next, for each extracted risk and opportunity, we considered, while referencing published scenarios, the assumed external environment and outcomes our company could face under the 1.5℃ and 4℃ scenarios for each target year. We then organized the calculation logic forming the basis for our financial impact estimates and the internal and external data required for the calculations. After calculating the actual financial impact using the collected data, we conducted a three-tier assessment of the relevant risks and opportunities based on their degrees of likelihood and impact, thereby assessing the importance* of each to our company. Finally, based on the results of our financial impact estimates and assessments of importance, we considered countermeasure policies for each item.
* Importance levels were determined by multiplying the level of impact (1–3) by the likelihood of occurrence (1–3), then assessing the result as large, medium, or small based on the matrix diagram shown on the right.
The impact levels were scored as follows: 1, for an impact on sales or costs between 100 million and 500 million yen; 2, for an impact between 500 million and 1 billion yen; and 3, for an impact exceeding 1 billion yen.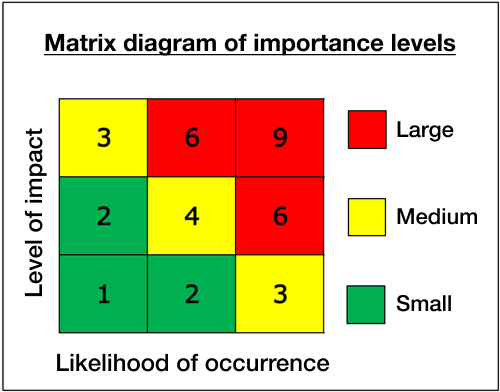
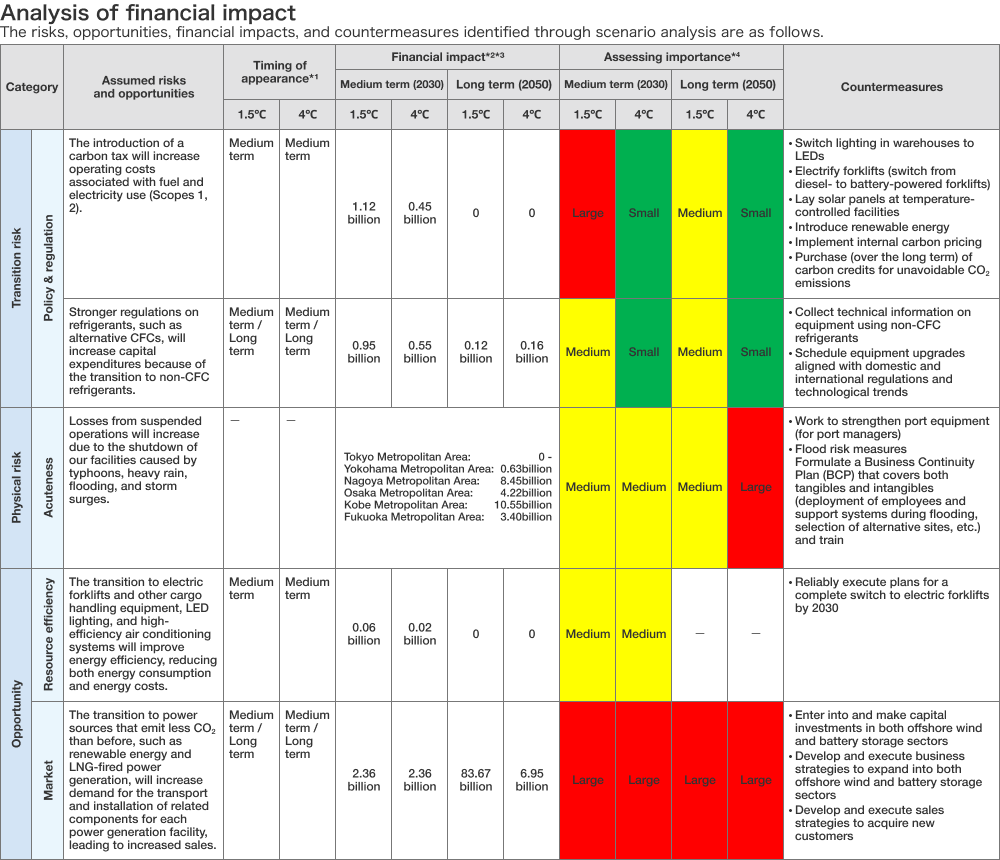
- *1 Medium term refers to 2025–2030, while long term refers to 2031–2050. Since these risks are assumed to occur at most once every 1,000 years, the financial impact of one occurrence is assessed.
- *2 For financial impact, the medium term estimates the single-year monetary impact for FY2030, while the long term does so for FY2050. The financial impact is calculated based on the impact of the assumed maximum-scale storm surge.
- *3 Minus sign (–): negative impact on P/L; plus sign (+): positive impact on P/L
- *4 Assessment of importance. Refer to “Process for conducting scenario analysis” above for our decision-making process.
Indicators and targets
■ Climate change-related targets
Amid the accelerated global movement toward a carbon-zero society, the Japanese government has identified CO2 reduction targets as part of efforts to achieve carbon neutrality.
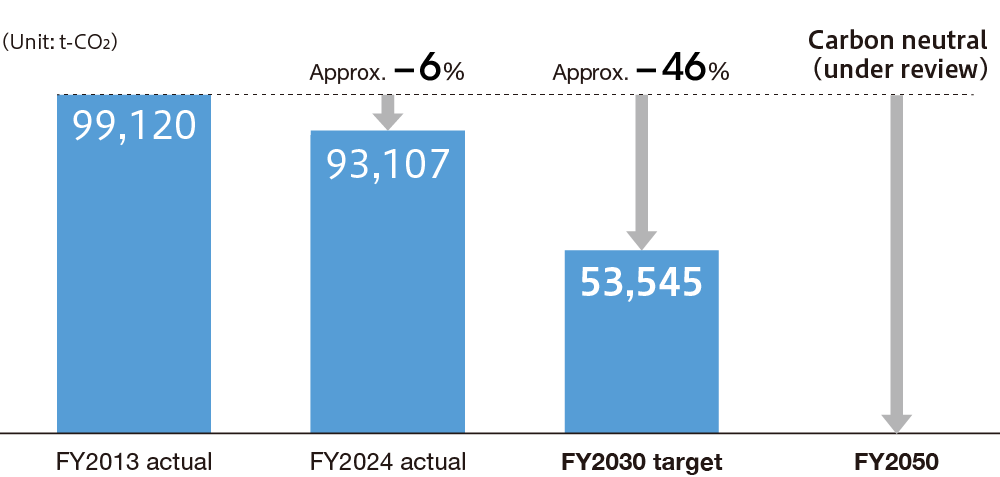
Together with the government targets, Kamigumi has identified the medium-term target to be achieved by FY2030 of reducing CO2 emissions (domestic Scope 1 + Scope 2 emissions) by 46% vs. 2013 levels.
We will continue to consider long-term targets (FY2050) from the perspective of efficacy, reflecting the understanding that achieving carbon neutrality is a global goal.
In addition, because we began calculating Scope 3 emissions in FY2024, we will consider Scope 3 reduction targets going forward.
・Target for FY2030: 46% reduction
・Target for FY2050: Carbon neutral (under review)
■ Climate change-related results
Our CO2 emissions data are as follows.
Total CO2 emissions from our Japanese operations (Scope 1, Scope 2)
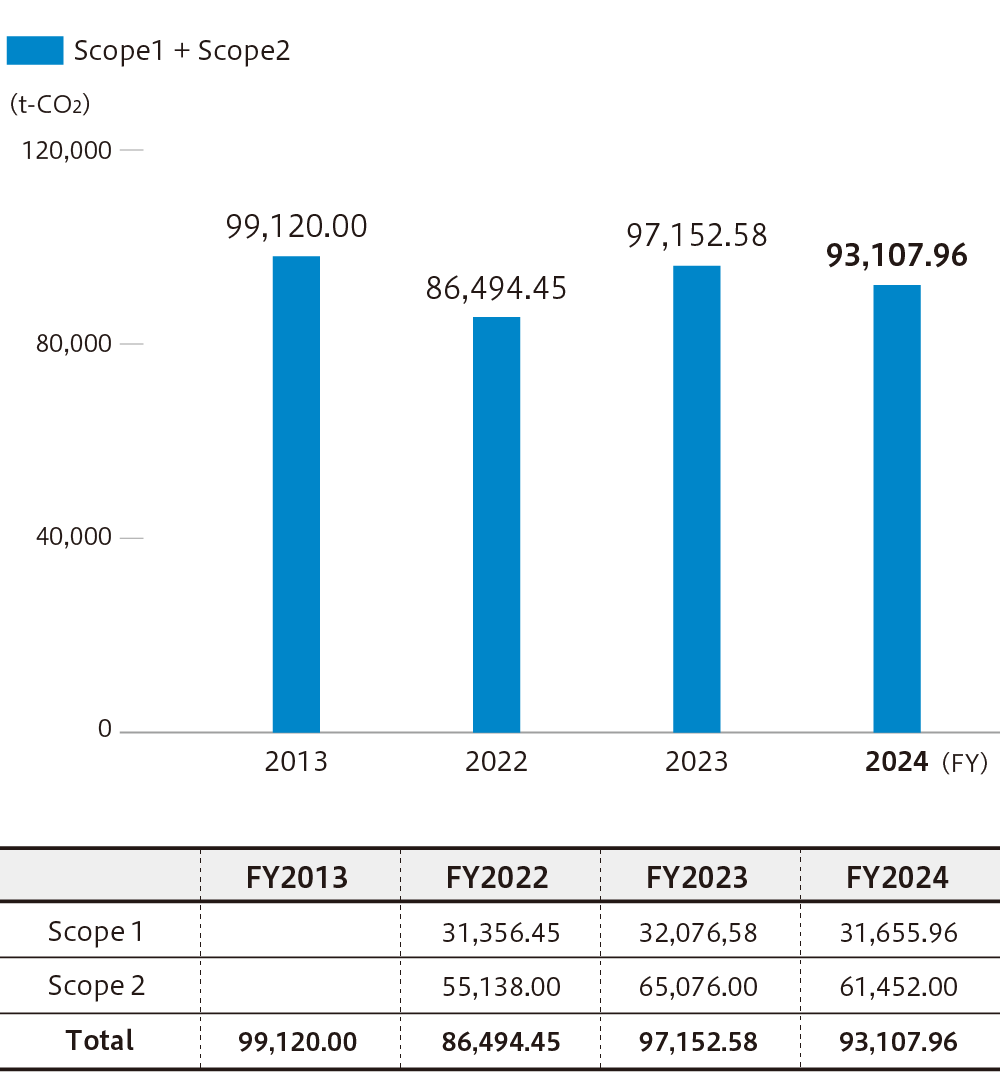
- * Scope 1 and 2 emissions are calculated based on the GHG Protocol for domestic business activities
Climate change-related results
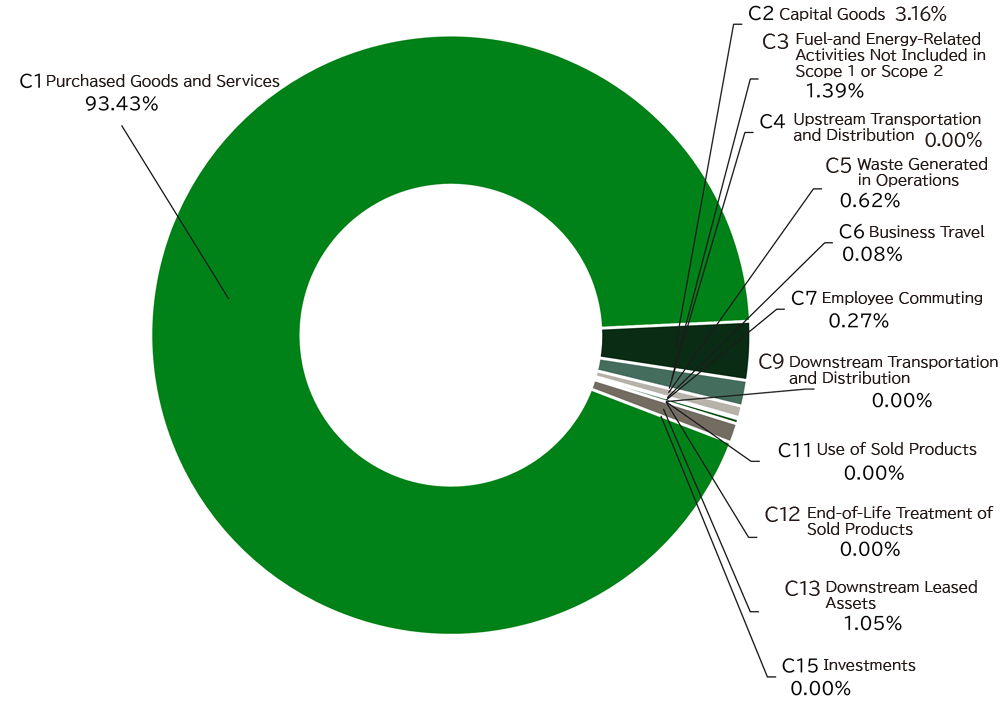
Breakdown of Scope 3 CO2 emissions (FY2023)
| Emissions (t-CO2e) | |||
|---|---|---|---|
| Category 1: Purchased Goods and Services | 635,149.19 | Category 9: Downstream Transportation and Distribution | Not applicable |
| Category 2: Capital Goods | 21,486.18 | Category 10: Processing of Sold Products | Not applicable |
| Category 3: Fuel-and Energy-Related Activities Not Included in Scope 1 or Scope 2 | 9,483.68 | Category 11: Use of Sold Products | Not applicable |
| Category 4: Upstream Transportation and Distribution | - | Category 12: End-of-Life Treatment of Sold Products | - |
| Category 5: Waste Generated in Operations | 4,241.19 | Category 13: Downstream Leased Assets | 7,139.80 |
| Category 6: Business Travel | 544.96 | Category 14: Franchises | Not applicable |
| Category 7: Employee Commuting | 1,802.96 | Category 15: Investments | Not applicable |
| Category 8: Upstream Leased Assets | Not applicable | Scope 3 total | 679,847.97 |
| Emissions (t-CO2e) | |
|---|---|
| Category 1: Purchased Goods and Services | 635,149.19 |
| Category 2: Capital Goods | 21,486.18 |
| Category 3: Fuel-and Energy-Related Activities Not Included in Scope 1 or Scope 2 | 9,483.68 |
| Category 4: Upstream Transportation and Distribution | - |
| Category 5: Waste Generated in Operations | 4,241.19 |
| Category 6: Business Travel | 544.96 |
| Category 7: Employee Commuting | 1,802.96 |
| Category 8: Upstream Leased Assets | Not applicable |
| Category 9: Downstream Transportation and Distribution | Not applicable |
| Category 10: Processing of Sold Products | Not applicable |
| Category 11: Use of Sold Products | Not applicable |
| Category 12: End-of-Life Treatment of Sold Products | - |
| Category 13: Downstream Leased Assets | 7,139.80 |
| Category 14: Franchises | Not applicable |
| Category 15: Investments | Not applicable |
| Scope 3 total | 679,847.97 |
Notes:
- *Emission intensity was calculated using the following:
·Ministry of the Environment “Emissions Intensity Database for Calculating Greenhouse Gas Emissions and Other Emissions of Organizations Through Supply Chains (Ver.3.4)”
·IDEA (Ver. 2.3) - *Calculated for domestic operations in Japan
- Calculated in accordance with the GHG Protocol
- The calculation period is from April 2023 to March 2024.
- *Category 1 is calculated by assigning the 26 types of departmental purchase items from the FY2023 payment database.
Breakdown of Scope 3 (%)
Notes:
- *Categories 4 and 12 are currently uncalculated due to difficulties in data collection.
- *Category 8 includes vehicle leases, but fuel is accounted for under Scope 1.
- *Category 9, we do not sell products, so there is no related transportation and delivery.
- *Category 10, we do not sell products, so there is no processing of sold products.
- *Category 11, we do not sell products, so there are no emissions when they are used.